Market Outlook
May 02, 2019
Market Cues
Domestic Indices
Chg (%)
(Pts)
(Close)
Indian markets are likely to open negative tracking global indices and SGX Nifty.
BSE Sensex
(0.1)
(36)
39,032
Nifty
(0.1)
(7)
11,748
US stocks came under pressure over the course of the trading session on
Mid Cap
(0.4)
66)
15,064
Wednesday. The major averages slid firmly into negative territory, with the S&P 500
pulling back off a record intraday high. The Dow fell 0.6 percent to 26,430 while
Small Cap
(0.2)
(25)
14,813
the Nasdaq was ended lower by 0.6 percent to 8,049.
Bankex
1.5
509
33,742
U.K. markets ended weak on Wednesday with investors treading cautiously ahead of
the U.S. Federal Reserve's monetary policy announcement. Other markets in Europe
Global Indices
Chg (%)
(Pts)
(Close)
were closed for the May Day holiday. FTSE 100 was down by 0.4 percent at 7,385.
Dow Jones
(0.6)
(163)
26,430
Nasdaq
(0.6)
(46)
8,049
On domestic front, Indian markets were closed on Wednesday on account of
Maharashtra Day. On Tuesday,
Indian shares recouped early losses to end flat on
FTSE
(0.4)
(33)
7,385
as banks succumbed to heavy selling pressure after Yes Bank reported a massive
Nikkei
0.5
108
22,307
quarterly loss, hit by rising provisions for bad loans. The benchmark BSE Sensex
Hang Seng
(0.9)
(256)
29,549
dipped by 0.1 percent at 39,032
Shanghai Com
(2.5)
(78)
3,123
News Analysis
Advances / Declines
BSE
NSE
India's core sector growth rises 4.7% in March, most in five months
Advances
706
480
Detailed analysis on Pg2
Declines
1,813
1,401
Investor’s Ready Reckoner
Unchanged
166
71
Key Domestic & Global Indicators
Volumes (` Cr)
Stock Watch: Latest investment recommendations on 150+ stocks
Refer Pg5 onwards
BSE
5,993
NSE
38,670
Top Picks
CMP
Target
Upside
Company
Sector
Rating
(`)
(`)
(%)
Net Inflows (` Cr)
Net
Mtd
Ytd
Blue Star
Capital Goods
Buy
683
867
26.9
FII
840
17,469
67,761
ICICI Bank
Financials
Buy
408
460
12.8
*MFs
(552)
(1,688)
(151)
Parag Milk Foods
Others
Buy
241
330
37.1
Bata India
Others
Accumulate
1,454
1,608
10.6
KEI Industries
Capital Goods
Buy
409
486
18.9
Top Gainers
Price (`)
Chg (%)
More Top Picks on Pg4
TATASTEELPP
81
10.0
BLUEDART
3266
5.6
Key Upcoming Events
Previous
Consensus
ORIENTCEM
107
5.4
Date
Region
Event Description
ReadingExpectations
VBL
876
5.1
Mar 26, 2019
TU Central Bank Inflation Report
JSWSTEEL
308
4.8
Mar 27, 2019
TH Exports YoY
0.06
--
Mar 27, 2019
TH Exports
$22380m
--
Mar 30, 2019
TH Imports YoY
0.24
--
Top Losers
Price (`)
Chg (%)
Mar 30, 2019
TH Imports
$21776m
--
YESBANK
168
-29.2
More Events on Pg7
RPOWER
6
-18.1
ANDHRABANK
24
-11.5
IFCI
11
-10.0
RELINFRA
108
-9.9
As on Apr 30, 2019
Market Outlook
May 02, 2019
News Analysis
India's core sector growth rises 4.7% in March, most in five
months
The core sector of the economy recorded 4.7 per cent growth in March, the
Cement production, too, improved rapidly last month.
the previous year.
Data released by the Ministry of Commerce and Industry on Tuesday showed that
the eight segments — coal, crude oil, natural gas, refinery products, fertiliser,
steel, cement and electricity
— witnessed growth recoveries in March after
2.2 per cent.
Refinery products, which command almost 30 per cent of the core sector index,
rose by 4.3 per cent in March, breaking a contractionary spell that had gripped
the sector since December 2018.
In the energy space, lower crude oil prices continued to impact oil production as
cent, the highest margin of contraction in FY19. The sector has seen a contraction
every month over the past year. However, natural gas production continued to
grow, albeit at a slower pace. In March, the natural gas output rose by 1.4 per
cent as against 3.8 per cent in the previous month.
Economic and Political News
GST collections jump 10% to an all-time high of ₹1.13 trillion in April
Fed keeps interest rates steady as U.S. economy motors along
Corporate News
Market Outlook
May 02, 2019
Quarterly Bloomberg Brokers Consensus Estimate
Tata Power Ltd - May 02, 2019
Particulars (` cr)
4QFY19E
4QFY18
y-o-y (%)
3QFY19
q-o-q (%)
Sales
8,338
7,230
15.3
7,707
8.2
EBIDTA
1,528
1,227
24.5
1,432
6.7
%
18.3
17.0
18.6
PAT
284
1,291
(78)
127
123.7
Dabur India Ltd - May 02, 2019
Particulars (` cr)
4QFY19E
4QFY18
y-o-y (%)
3QFY19
q-o-q (%)
Sales
2,220
2,033
9.2
2,199
0.9
EBIDTA
516
1,548
(66.7)
1,754
(70.6)
%
23.3
76.1
79.8
PAT
425
396
7.2
366
16.0
MRF Ltd - May 02, 2019
Particulars (` cr)
4QFY19E
4QFY18
y-o-y (%)
3QFY19
q-o-q (%)
Sales
4,140
3,865
7.1
4,034
2.6
EBIDTA
629
686
(8.3)
552
14.0
%
15.2
17.7
13.7
PAT
299
345
(13.3)
279
7.2
Market Outlook
May 02, 2019
Top Picks
Market Cap
CMP
Target
Upside
Company
Rationale
(` Cr)
(`)
(`)
(%)
Favorable outlook for the AC industry to augur well
for Cooling products business which is out pacing
Blue Star
6,582
683
867
26.9
the market growth. EMPPAC division's profitability
to improve once operating environment turns
around.
Well capitalized with CAR of 18.1% which gives
sufficient room to grow asset base. Faster
ICICI Bank
2,62,891
408
460
12.8
resolution of NPA would reduce provision cost,
which would help to report better ROE.
High order book execution in EPC segment, rising
KEI Industries
3,226
409
486
18.9
B2C sales and higher exports to boost the revenues
and profitability
Expected to benefit from the lower capex
Music Broadcast Limited
1,634
58
95
64.2
requirement and 15 year long radio broadcast
licensing.
Strong brands and distribution network would
Siyaram Silk Mills
1,667
356
606
70.4
boost growth going ahead. Stock currently trades
at an inexpensive valuation.
GST regime and the Gujarat plant are expected to
Maruti Suzuki
2,01,146
6,659
10,820
62.5
improve the company’s sales volume and margins,
respectively.
We expect loan book to grow at 24.3% over next
GIC Housing
1,387
258
424
64.7
two year; change in borrowing mix will help in NIM
improvement
Third largest brand play in luggage segment
Increased product offerings and improving
Safari Industries
1,628
729
1,000
37.1
distribution network is leading to strong growth in
business. Likely to post robust growth for next 3-4
years
We expect financialisation of savings and
Aditya Birla Capital
21,530
98
151
54.4
increasing penetration in Insurance & Mutual fund
would ensure steady growth.
One of the leading Indian dairy products
companies in India created strong brands in dairy
products. Rising revenue share of high-margin
Parag Milk Foods
2,025
241
330
37.1
Value Added Products and reduction in interest cost
is likely to boost margins and earnings in next few
years.
HDFC Bank maintained its steady growth in the
4QFY18. The bank’s net profit grew by 20.3%.
Steady growth in interest income and other income
HDFC Bank
6,30,984
2,316
2,500
8.0
aided PAT growth. The Strong liability franchise
and healthy capitalisation provides strong earning
visibility. At the current market price, the bank is
trading at 3.2x FY20E ABV.
Market Outlook
May 02, 2019
Continued...
Market Cap
CMP
Target
Upside
Company
Rationale
(` Cr)
(`)
(`)
(%)
We expect strong PAT growth on back of
healthy growth in automobile segment (on back
of new launches and facelifts in some of the
M&M
80,242
645
1,050
62.7
model ) and strong growth in Tractors segment
coupled by its strong brand recall and
improvement in rural sentiment
Market leader in the room air conditioner (RAC)
outsourced manufacturing space in India with a
market share of
55.4%. It is a one-stop
Amber Enterprises
2,460
782
984
25.8
solutions provider for the major brands in the
RAC industry and currently serves eight out of
the 10 top RAC brands in India
BIL is the largest footwear retailer in India,
offering footwear, accessories and bags across
brands. We expect BIL to report net PAT CAGR
of
~16% to
~`3115cr over FY2018-20E
Bata India
18,685
1,454
1,608
10.6
mainly due to new product launches, higher
number of stores addition and focus on
women’s high growth segment and margin
improvement
SHTF is in the sweet spot with benefits from
stronger CV volumes, NIMs unaffected by rising
Shriram Transport Finance
25,185
1,110
1,764
58.9
bond yields on the back of stronger pricing
power and an enhancing ROE by 750bps over
FY18-20E, supported by decline in credit cost.
We expect JSPL’s top line to grow at 27% CAGR
over FY19-FY20 on the back of strong steel
demand and capacity addition. On the bottom
Jindal Steel & Power Limited
17,274
178
327
84.2
line front, we expect JSPL to turn in to profit by
FY19 on back of strong operating margin
improvement.
GMM Pfaudler Limited (GMM) is the Indian
market leader in glass-lined (GL) steel
equipment. GMM is expected to cross CAGR
GMM Pfaudler Ltd
1,771
1,211
1,400
15.6
15%+ in revenue over the next few years
mainly led by uptick in demand from user
industries and it is also expecting to increase its
share of non-GL business to 50% by 2020.
Aurobindo Pharmaceuticals, amongst the
Indian Pharmaceutical companies, is well
placed to face the challenging generic markets,
given its focus on achieving growth through
Aurobindo Pharmaceuticals
47,966
819
890
8.7
productivity. Aurobindo will report net revenue
& net profit CAGR of ~13% & ~8% resp.
during FY2018-20E. Valuations are cheap V/s
its peers and own fair multiples of 17-18x.
We believe advance to grow at a healthy CAGR
of 35% over FY18-20E. Below peers level ROA
RBL Bank
28,965
679
763
12.4
(1.2% FY18) to expand led by margin
expansion and lower credit cost.
TTK Prestige has emerged as one of the leading
brands in kitchen appliances in India after its
successful transformation from a single product
TTK Prestige
9,447
8,178
9,250
13.1
company to offering an entire gamut of home
and kitchen appliances. We are expecting a
CAGR of 18% in revenue and 25% in PAT over
FY2018-20.
Maintain Hold.
Source: Company, Angel Research
Market Outlook
May 02, 2019
Continued...
Market Cap
CMP
Target
Upside
Company
Rationale
(` Cr)
(`)
(`)
(%)
We expect Inox Wind to report exponential
growth in top-line and bottom-line over FY19-
20E. The growth would be led by changing
renewable energy industry dynamics in favor of
Inox Winds
1,426
64
120
86.8
wind energy segment viz. changes in auction
regime from Feed-In-Tariff (FIT) to reverse
auction regime and Government’s guidance for
10GW auction in FY19 and FY20 each.
Considering the strong CV demand due to
change in BS-VI emission norms (will trigger
pre-buying activities), pick up in construction
Ashok Leyland
25,451
87
156
79.9
activities and no significant impact on industry
due to recent axle load norms, we recommend
BUY on Ashok Leyland at current valuations.
Source: Company, Angel Research
Fundamental Call
Market Cap
CMP
Target
Upside
Company
Rationale
(` Cr)
(`)
(`)
(%)
CCL is likely to maintain the strong growth
CCL Products
3,459
260
360
38.5
trajectory over FY18-20 backed by capacity
expansion and new geographical foray
We forecast Nilkamal to report top-line CAGR of
~9% to `2,635cr over FY17-20E on the back of
Nilkamal
1,973
1,323
2,178
64.7
healthy demand growth in plastic division. On the
bottom-line front, we estimate
~10% CAGR to
`162cr owing to improvement in volumes.
Elantas Beck India is the Indian market leader in
liquid insulation segment used in electrical
equipments like motors, transformers etc. It derives
Elantas Beck India Ltd
1,829
2,306
2,500
8.4
demand from several industries which are expected
to register 10%+ CAGR in demand in the coming
years. We can book out from the stock with 16%
profit at Rs. 2500 TP.
Greenply Industries Ltd (GIL) manufactures plywood
& allied products and medium density fibreboards
(MDF). GIL to report net revenue CAGR of ~14% to
Greenply Industries
2,033
166
256
54.4
~`2,478cr over FY2017-20E mainly due to healthy
growth in plywood & lamination business on the
back of strong brand and distribution network
L&T Fin’s new management is on track to achieve
L&T Finance Holding
26,214
131
210
60.2
ROE of 18% by 2020 and recent capital infusion of
`3000cr would support advance growth.
Well planned strategy to grow small business loans
and cross-selling would propel fees income. We
Yes Bank
38,916
168
290
72.6
expect YES to grow its advance much higher than
industry and improvement in asset quality to
support profitability.
Market Outlook
May 02, 2019
Global economic events release calendar
Date
Time
Country
Event Description
Unit
Period
Bloomberg Data
Last Reported
Estimated
April 18, 2019
JN
Housing Starts YoY
% Change
Sep
0.02
(0.01)
April 18, 2019
JN
Annualized Housing Starts
% Change
Sep
0.957m
0.950m
April 19, 2019
JN
Construction Orders YoY
% Change
Sep
0.01
--
April 20, 2019
12:00 AM
ES
Industrial Production YoY
% Change
Sep
0.06
--
April 20, 2019
12:00 AM
RO
ILO Unemployment Rate
% Change
Sep
0.04
--
April 23, 2019
3:15 AM
DE
Unemployment Rate SA
% Change
Sep
0.03
--
April 24, 2019
4:30 AM
DE
Unemployment Rate Gross Rate
% Change
Sep
0.04
0.04
April 24, 2019
4:30 AM
FI
Trade Balance
% Change
Aug F
-400m
--
April 25, 2019
4:30 AM
TU
Economic Confidence
% Change
Oct
71.00
--
April 25, 2019
5:20 AM
TU
Trade Balance
% Ratio
Sep
-2.42b
-1.90b
May 02, 2019
5:20 AM
TU
Central Bank Inflation Report
%
May 02, 2019
5:30 AM
TH
Exports YoY
% Change
Sep
0.06
--
May 03, 2019
5:30 AM
TH
Exports
% Change
Sep
$22380m
--
May 04, 2019
5:31 AM
TH
Imports YoY
%
Sep
0.24
--
May 08, 2019
5:31 AM
TH
Imports
%
Sep
$21776m
--
May 08, 2019
5:31 AM
TH
Trade Balance
Thousands
Sep
$604m
--
May 10, 2019
6:00 AM
TH
BoP Current Account Balance
% Change
Sep
$753m
$1200m
May 11, 2019
0-Jan-00
AU
CPI YoY
% Change
3Q
0.02
0.02
Source: Company, Angel Research
Market Outlook
May 02, 2019
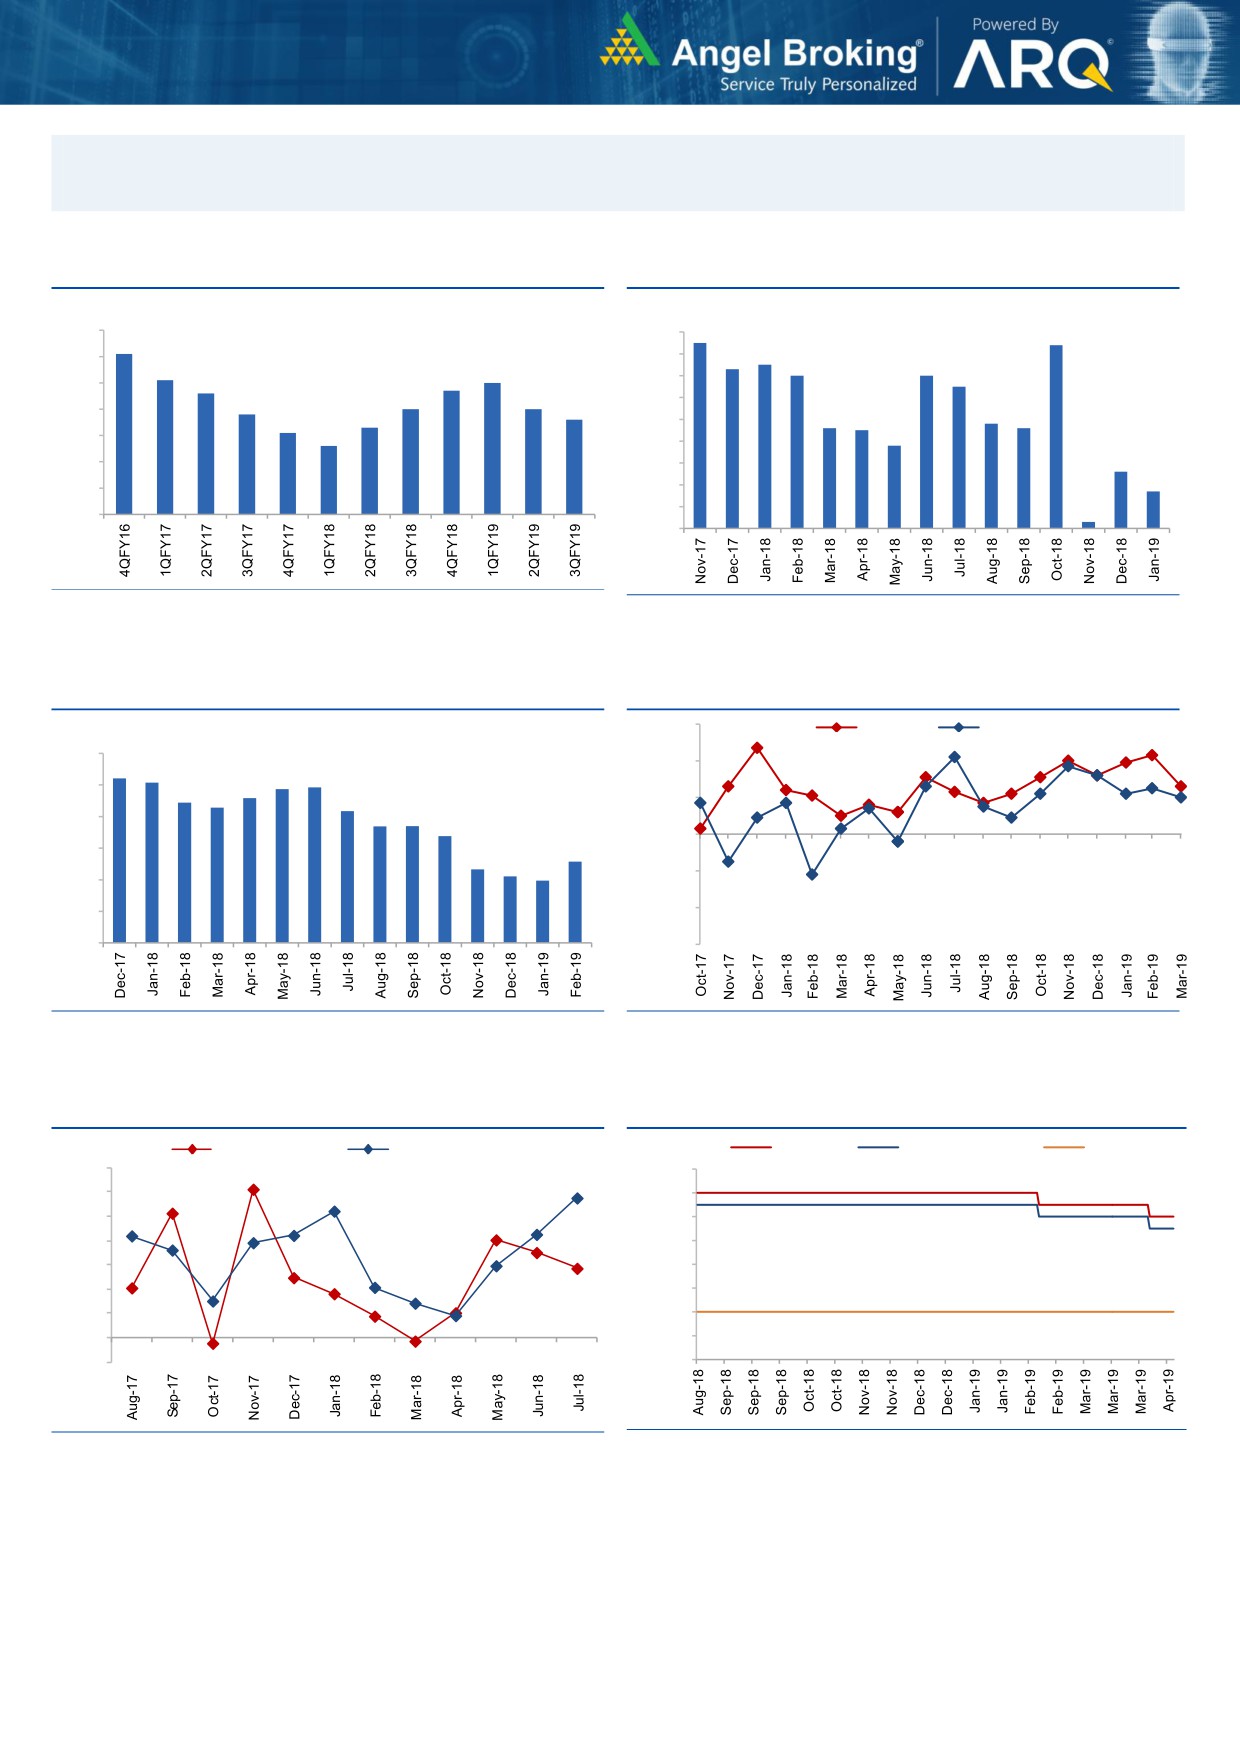
Macro watch
Exhibit 1: Quarterly GDP trends
Exhibit 2: IIP trends
(%)
(%)
10.0
8.5
8.4
9.1
9.0
7.3
7.5
9.0
8.0
7.0
7.0
8.1
8.0
7.6
7.7
7.0
6.5
8.0
7.0
7.0
6.8
6.6
6.0
7.0
6.3
4.6
4.5
4.8
4.6
6.1
5.0
5.6
3.8
6.0
4.0
2.6
5.0
3.0
1.7
4.0
2.0
1.0
0.3
3.0
-
Source: CSO, Angel Research
Source: MOSPI, Angel Research
Exhibit 3: Monthly CPI inflation trends
Exhibit 4: Manufacturing and services PMI
56.0
Mfg. PMI
Services PMI
(%)
6.0
5.2
5.07
54.0
4.9
4.9
5.0
4.4
4.6
4.3
4.2
52.0
3.7
3.7
4.0
3.4
50.0
3.0
2.6
2.3
2.1
2.0
48.0
2.0
1.0
46.0
-
44.0
Source: MOSPI, Angel Research
Source: Market, Angel Research; Note: Level above 50 indicates expansion
Exhibit 5: Exports and imports growth trends
Exhibit 6: Key policy rates
(%)
Exports yoy growth
Imports yoy growth
(%)
Repo rate
Reverse Repo rate
CRR
35.0
7.00
30.0
6.50
25.0
6.00
20.0
5.50
15.0
5.00
10.0
4.50
5.0
4.00
0.0
3.50
(5.0)
3.00
Source: Bloomberg, Angel Research As of 15 April, 2019
Source: RBI, Angel Research
Market Outlook
May 02, 2019
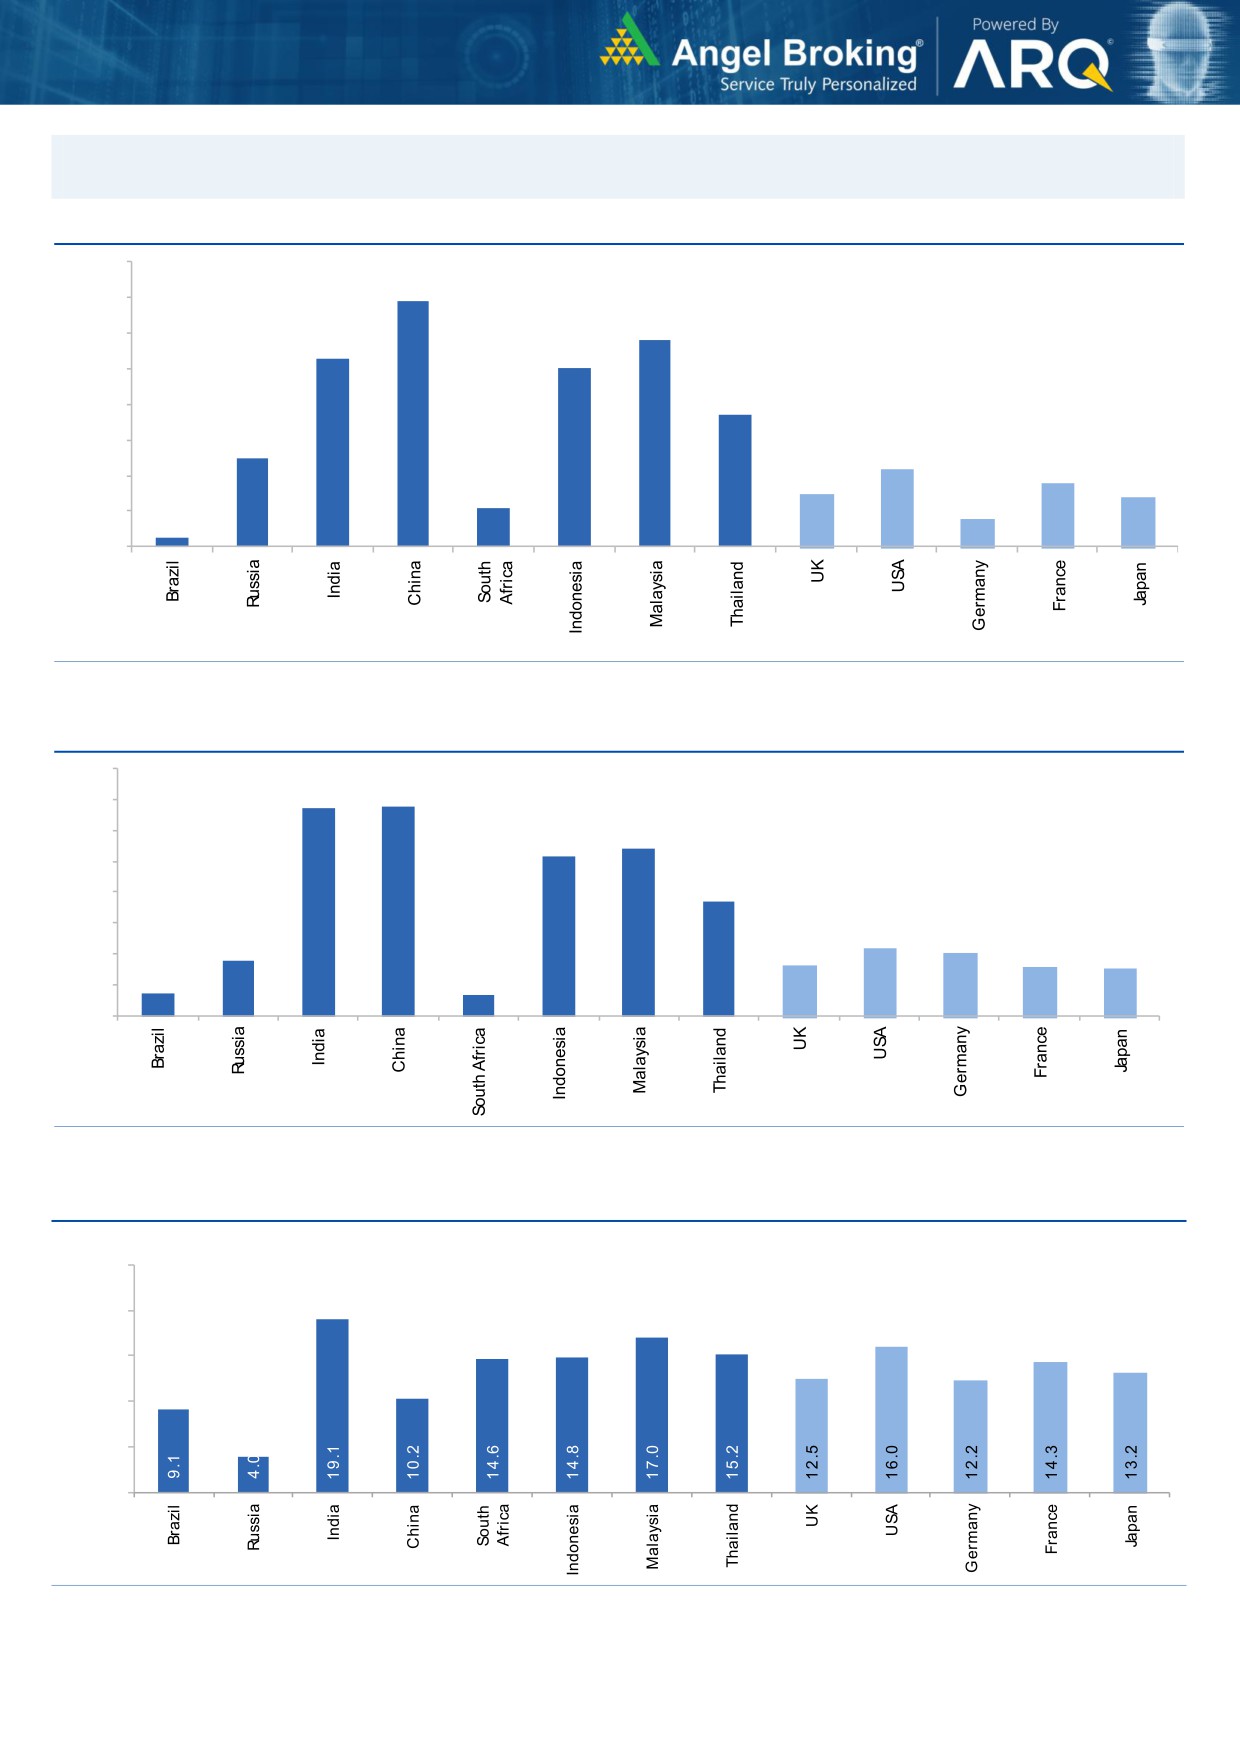
Global watch
Exhibit 1: Latest quarterly GDP Growth (%, yoy) across select developing and developed countries
8.0
(%)
6.9
7.0
5.8
6.0
5.3
5.0
5.0
1.1
3.7
4.0
2.5
3.0
2.2
1.8
2.0
1.5
1.4
0.8
1.0
0.3
-
Source: Bloomberg, Angel Research
Exhibit 2: 2017 GDP Growth projection by IMF (%, yoy) across select developing and developed countries
(%)
6.7
6.8
7.0
6.0
5.4
5.2
5.0
3.7
4.0
3.0
1.8
2.2
2.0
1.7
1.6
2.0
0.7
1.5
0.7
1.0
-
Source: IMF, Angel Research
Exhibit 3: One year forward P-E ratio across select developing and developed countries
(x)
25.0
20.0
15.0
10.0
5.0
-
Source: IMF, Angel Research As of 25 Sep, 2018
Market Outlook
May 02, 2019
Exhibit 4: Relative performance of indices across globe
Returns (%)
Country
Name of index
Closing price
1M
3M
1YR
Brazil
Bovespa
95,415
-0.2
8.6
11.8
Russia
Micex
2,497
0.5
5.4
10.0
India
Nifty
11,624
7.7
7.0
14.9
China
Shanghai Composite
3,091
5.1
23.9
-2.2
South Africa
Top 40
51,925
3.8
9.7
3.7
Mexico
Mexbol
44,686
-11.2
-15.1
-11.3
Indonesia
LQ45
1,006
-3.2
4.1
-8.5
Malaysia
KLCI
1,708
1.4
1.7
-8.0
Thailand
SET 50
1,099
0.2
0.6
-8.9
USA
Dow Jones
25,929
0.1
11.2
7.6
UK
FTSE
7,279
2.4
8.2
-1.6
Japan
Nikkei
21,206
-1.8
-6.0
-1.2
Germany
DAX
11,526
-0.7
9.2
-4.7
France
CAC
5,351
2.1
13.1
-2.1
Source: Bloomberg, Angel Research As of 15 April, 2019
Market Outlook
May 02, 2019
Exhibit 7: Historical Angel Top Picks/Fundamental Calls
Date Added
Top Picks/Fundamental
Stocks
Reco Price
Target/Revised Price
Current Status
17-08-2018
Top Picks
Ashok Leyland
128
156
Open
10-08-2018
Top Picks
Inox Wind
107
127
Open
30-11-2018
Top Picks
TTK Prstige
7,206
8,200
Open
09-08-2018
Top Picks
TTK Prstige
6,206
7,500
06-07-2018
Top Picks
Aurobindo Pharma
603
780
Open
30-08-2018
Top Picks
RBL Bank
626
690
Open
06-07-2018
Top Picks
RBL Bank
565
670
06-07-2018
Top Picks
Yes Bank
348
418
Open
30-06-2018
Top Picks
Jindal Steel & Power
222
350
Open
20-06-2018
Top Picks
Shriram Transport Finance Com
1,466
1,764
Open
30-07-2018
Top Picks
Bata India
918
1,007
Open
23-07-2018
Top Picks
Bata India
842
955
01-07-2018
Top Picks
Bata India
862
948
18-06-2018
Top Picks
Bata India
779
896
14-06-2018
Top Picks
Amber Enterprises
1,026
1,230
Open
07-06-2018
Top Picks
M&M
918
1050
Open
04-05-2018
Top Picks
M&M
860
990
03-05-2018
Fundamental
L&T Finance Holding
171
210
Open
02-05-2018
Top Picks
HDFC Bank
1944
2315
Open
04-05-2018
Top Picks
Matrimony.com Ltd
573
1016
Closed(17/08/2018)
20-04-2018
Top Picks
Matrimony.com Ltd
781
984
15-05-2018
Top Picks
Parag Milk Foods Limited
310
410
Open
16-04-2018
Top Picks
Parag Milk Foods Limited
249
333
27-08-2018
Top Picks
GMM Pfaudler Limited
1,170
1,287
Open
18-08-2018
Top Picks
GMM Pfaudler Limited
1,024
1,200
07-08-2018
Top Picks
GMM Pfaudler Limited
984
1,100
29-06-2018
Fundamental
GMM Pfaudler Limited
932
1,020
14-05-2018
Fundamental
GMM Pfaudler Limited
818
900
06-04-2018
Fundamental
GMM Pfaudler Limited
712
861
07-03-2018
Fundamental
Ashok Leyland Ltd
139
163
Closed (26/04/2018)
03-03-2018
Fundamental
Greenply Industries
340
395
Open
27-08-2018
Top Picks
Safari Industries
974
1,071
Open
14-08-2018
Top Picks
Safari Industries
868
1,000
07-08-2018
Top Picks
Safari Industries
788
870
16-07-2018
Top Picks
Safari Industries
693
800
16-04-2018
Top Picks
Safari Industries
651
750
21-02-2018
Top Picks
Safari Industries
532
650
31-05-2018
Top Picks
HSIL Ltd
348
Closed (31/05/2018)
16-02-2018
Top Picks
HSIL Ltd
433
510
07-02-2018
Fundamental
Elantas Beck India Ltd.
2155
2500
Open
01-02-2018
Top Picks
ICICI Bank
352
416
Open
01-02-2018
Top Picks
Aditya Birla Capital
167
218
Open
04-01-2018
Fundamental
CCL Products
278
360
Open
03-01-2018
Fundamental
Nilkamal Ltd
1880
2178
Open
01-01-2018
Fundamental
Capital First Ltd
693
850
Closed (15/01/2018)
30-12-2017
Fundamental
Shreyans Industries Ltd
205
247
Closed
Source: Company, Angel Research
Market Outlook
May 02, 2019
Exhibit 8: Historical Angel Top Picks/Fundamental Calls
Date Added
Top Picks/Fundamental
Stocks
Reco Price
Target/Revised Price
Current Status
Fundamental
Prism Cement Ltd
160
Closed (09/05/2018)
21-12-2017
Fundamental
Prism Cement Ltd
118
131
18-12-2017
Fundamental Menon Bearings Limited
92
114
Closed (17/01/2018)
14-12-2017
Top Picks
Ruchira Papers Ltd.
188
244
Closed (09/02/2018)
17-05-2018
Top Picks
Century Plyboards India
280
Closed(17/05/2018)
28-11-2017
Top Picks
Century Plyboards India
317
400
19-12-2017
Top Picks
LT Foods
85
Closed(18/06/2018)
06-11-2017
Top Picks
LT Foods
74
96
16-10-2017
FundamentalEndurance Technologies Ltd
1111
1277
Closed (01/12/2017)
11-09-2017
Top Picks
GIC Housing
533
655
Open
10-10-2017
Top Picks Music Broadcast Limited
404
475
Open
20-07-2017
Top Picks Music Broadcast Limited
368
434
07-07-2017
Fundamental L&T Finance Holdings Ltd
149
179
Closed (28/8/2017)
06-07-2017
Fundamental
Syngene International
478
564
Closed (1/3/2018)
05-07-2017
Top Picks
Maruti
7371
10619
Open
05-06-2017
Top Picks
Karur Vysya Bank
127
100
Closed (12/03/2018)
23-05-2018
Top Picks
KEI Industries
481
589
Open
04-01-2017
Top Picks
KEI Industries
125
485
31-05-2018
Top Picks
Alkem Lab
1978
Closed (31/05/2018)
01-12-2016
Top Picks
Alkem Lab
1700
2441
17-10-2016
Top Picks
Asian Granito
267
534
Closed (18/02/2018)
17-05-2018
Top Picks
TV Today Network
460
Closed (17/05/2018)
04-08-2016
Top Picks
TV Today Network
297
603
05-04-2016
Top Picks
DHFL
189
720
Open
25-06-2018
Top Picks
Navkar Corporation
207
Closed(25/06/2018)
05-01-2016
Top Picks
Navkar Corporation
207
265
Open
08-12-2015
Top Picks
Blue Star
357
867
Open
30-10-2015
Top Picks
Siyaram Silk Mills
186
851
Open
Source: Company
Market Outlook
May 02, 2019
Research Team Tel: 022 - 39357800
DISCLAIMER:
Angel Broking Limited (hereinafter referred to as “Angel”) is a registered Member of National Stock Exchange of India Limited,
Bombay Stock Exchange Limited, Metropolitan Stock Exchange Limited, Multi Commodity Exchange of India Ltd and National
Commodity & Derivatives Exchange Ltd It is also registered as a Depository Participant with CDSL and Portfolio Manager and
Investment Adviser with SEBI. It also has registration with AMFI as a Mutual Fund Distributor. Angel Broking Limited is a registered
entity with SEBI for Research Analyst in terms of SEBI (Research Analyst) Regulations, 2014 vide registration number INH000000164.
Angel or its associates has not been debarred/ suspended by SEBI or any other regulatory authority for accessing /dealing in
securities Market. Angel or its associates/analyst has not received any compensation / managed or co-managed public offering of
securities of the company covered by Analyst during the past twelve months.
This document is solely for the personal information of the recipient, and must not be singularly used as the basis of any investment
decision. Nothing in this document should be construed as investment or financial advice. Each recipient of this document should
make such investigations as they deem necessary to arrive at an independent evaluation of an investment in the securities of the
companies referred to in this document (including the merits and risks involved), and should consult their own advisors to determine
the merits and risks of such an investment.
Reports based on technical and derivative analysis center on studying charts of a stock's price movement, outstanding positions and
trading volume, as opposed to focusing on a company's fundamentals and, as such, may not match with a report on a company's
fundamentals. Investors are advised to refer the Fundamental and Technical Research Reports available on our website to evaluate
the contrary view, if any
The information in this document has been printed on the basis of publicly available information, internal data and other reliable
sources believed to be true, but we do not represent that it is accurate or complete and it should not be relied on as such, as this
document is for general guidance only. Angel Broking Limited or any of its affiliates/ group companies shall not be in any way
responsible for any loss or damage that may arise to any person from any inadvertent error in the information contained in this
report. Angel Broking Limited has not independently verified all the information contained within this document. Accordingly, we
cannot testify, nor make any representation or warranty, express or implied, to the accuracy, contents or data contained within this
document. While Angel Broking Limited endeavors to update on a reasonable basis the information discussed in this material, there
may be regulatory, compliance, or other reasons that prevent us from doing so.
This document is being supplied to you solely for your information, and its contents, information or data may not be reproduced,
redistributed or passed on, directly or indirectly.
Neither Angel Broking Limited, nor its directors, employees or affiliates shall be liable for any loss or damage that may arise from or in
connection with the use of this information.